Harry Kim
A home page to expand on my data analysis projects. All source code can be found on my GitHub profile!
View LinkedIn Profile
Harry’s Journey in Python
Current Ongoing Learnings & Projects
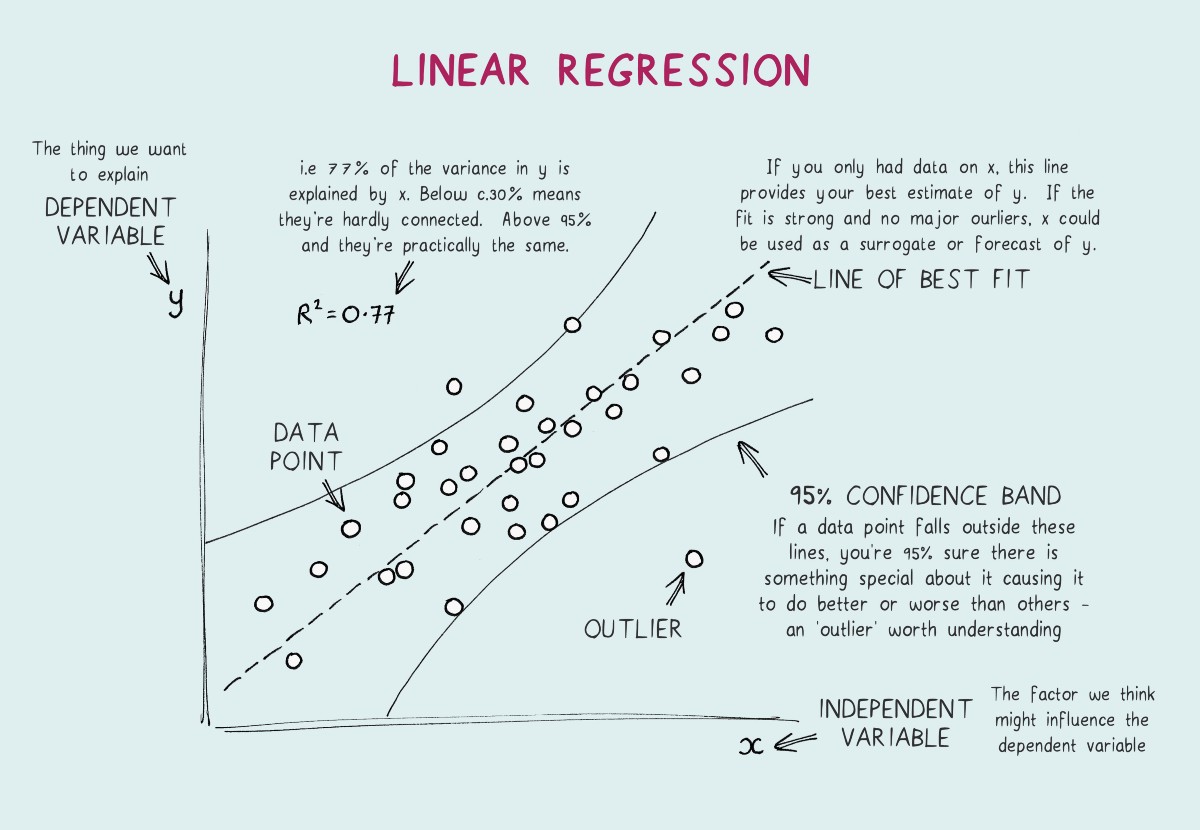
1. Linear Regression & Logistic Regression for People Analytics (Offline)
2. People Turnover Forecast (folked from Burunokatekawa)
Past Learnings & Projects
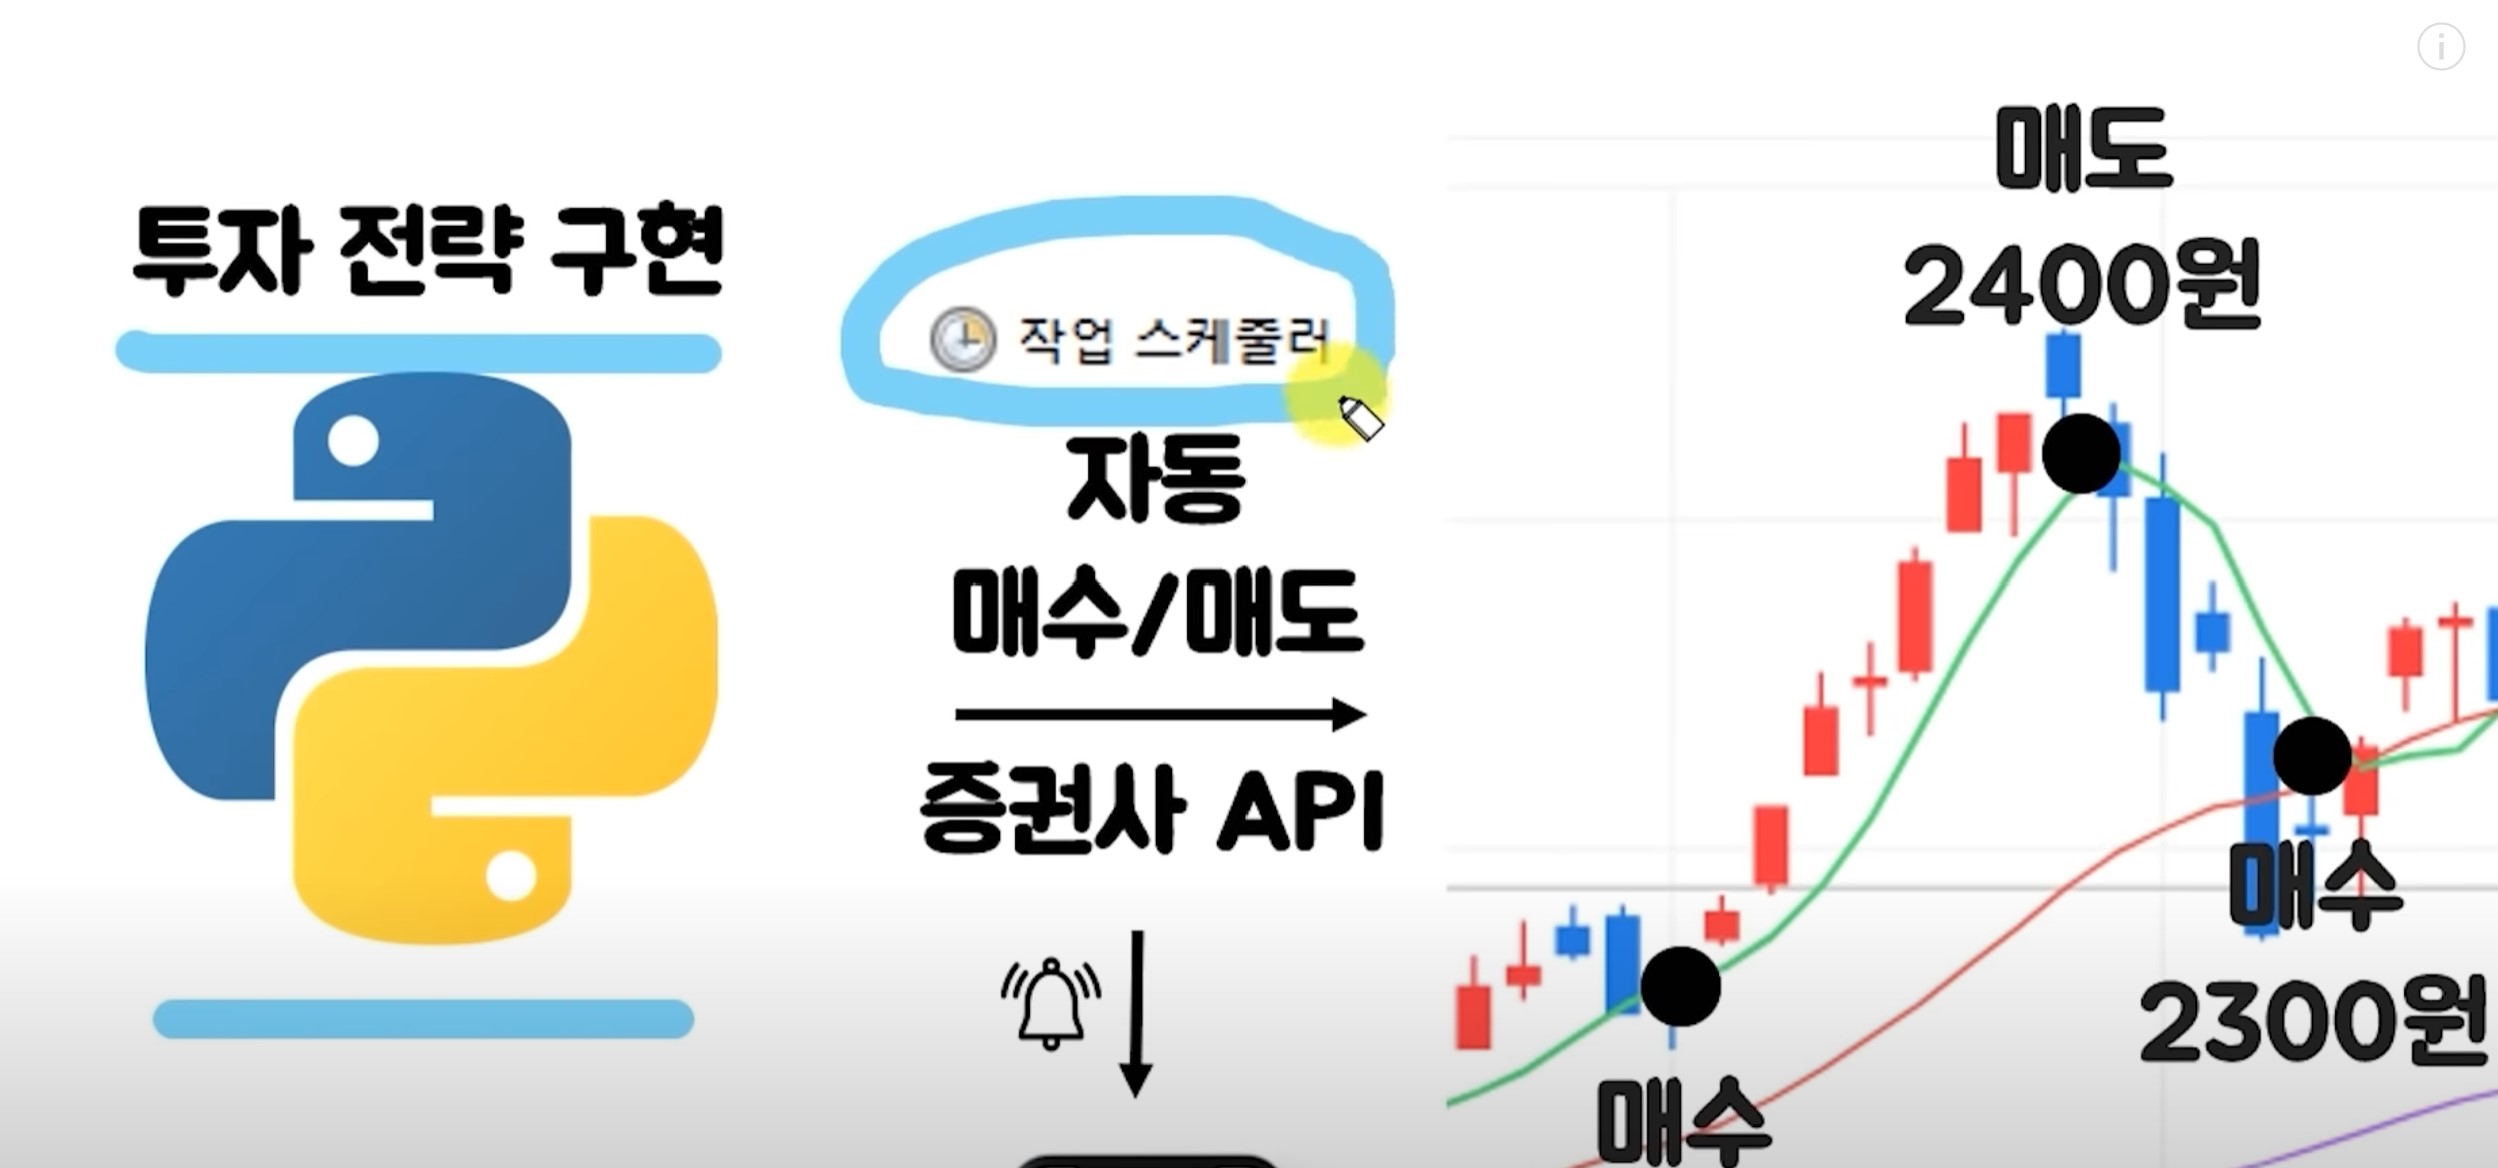
1. Automated Stock Analysis and Investment by Python
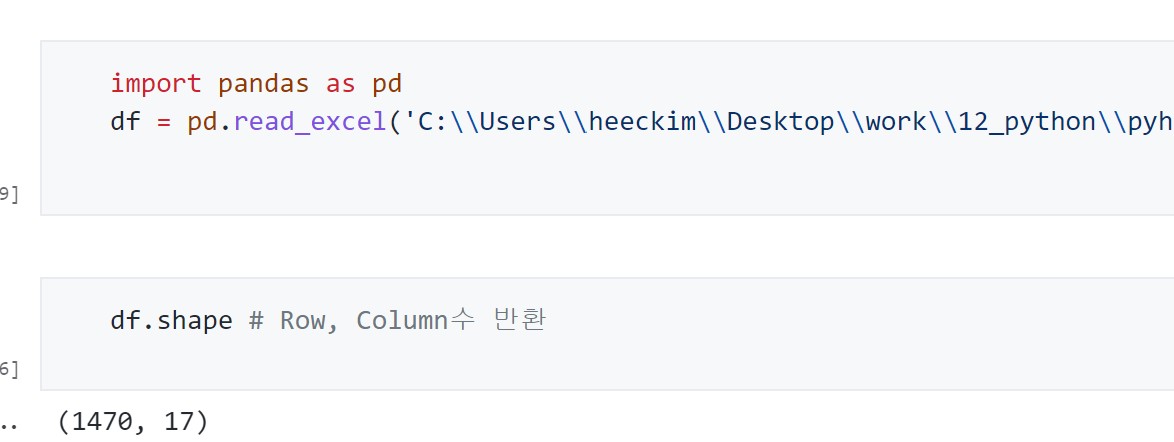
2. Importing Raw Data and Pre-Data Validation
3. Univariate Analysis (Numerical Variable) by Pandas
- Mean
- Median
- Mode
- Count
- Max
- Min
- Quantiles
- Varirance
- Standrad Deviation
- Range, Interquartile Range
- Histogram
4. Unvariate Analysis (Numerical Variable) by Pandas, Sklearn
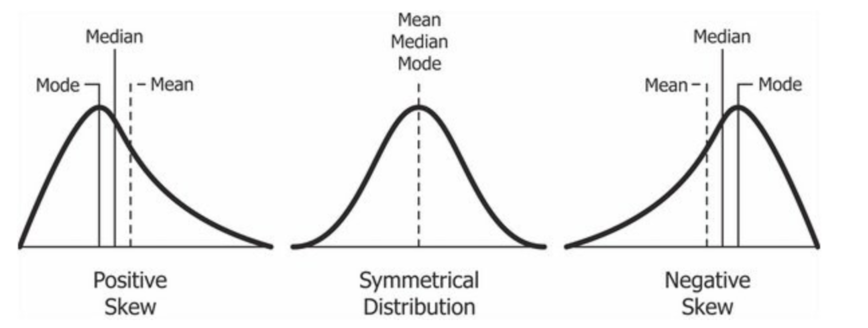
- Skewness
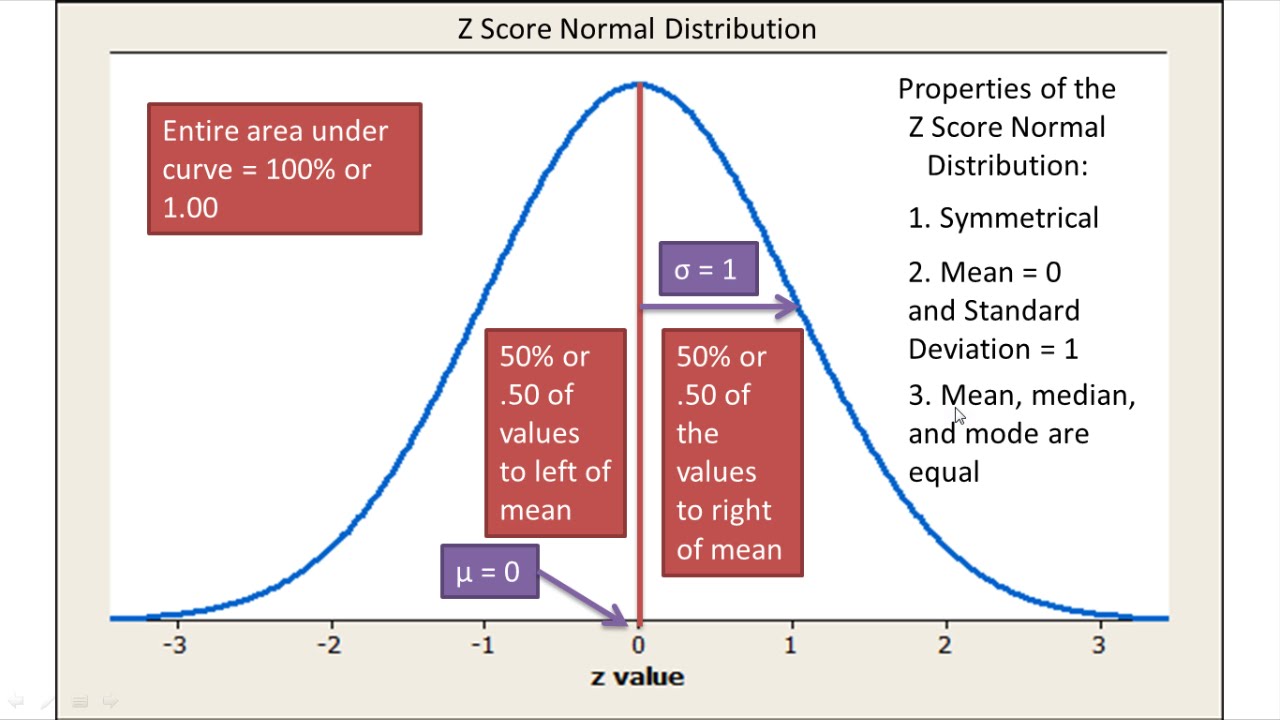
- Data Standardization (Z-Score Distribution)
5. Univariate Analysis (Categorical Variable) by Pandas
- Count
- Frequency
- Percentage
- Bar Chart
- Pie Chart
6. Data Clearning (Missing Values) by Pandas
- Removing N/A (Counting N/A)
- Replacing N/A with 0
- Replacing N/A with Mean
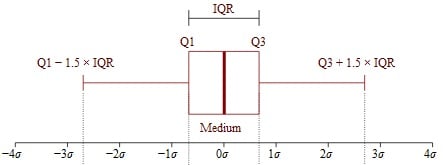
7. Data Clearning (Outliners) by Pandas, Scipy
- Filtering Data (Advanced Filter)
- Detection by Boxplot
- Detection by Z-Score
- Capping
- Flooring
8. Bi-variate Analysis (Numerical and Numerical) by Pandas
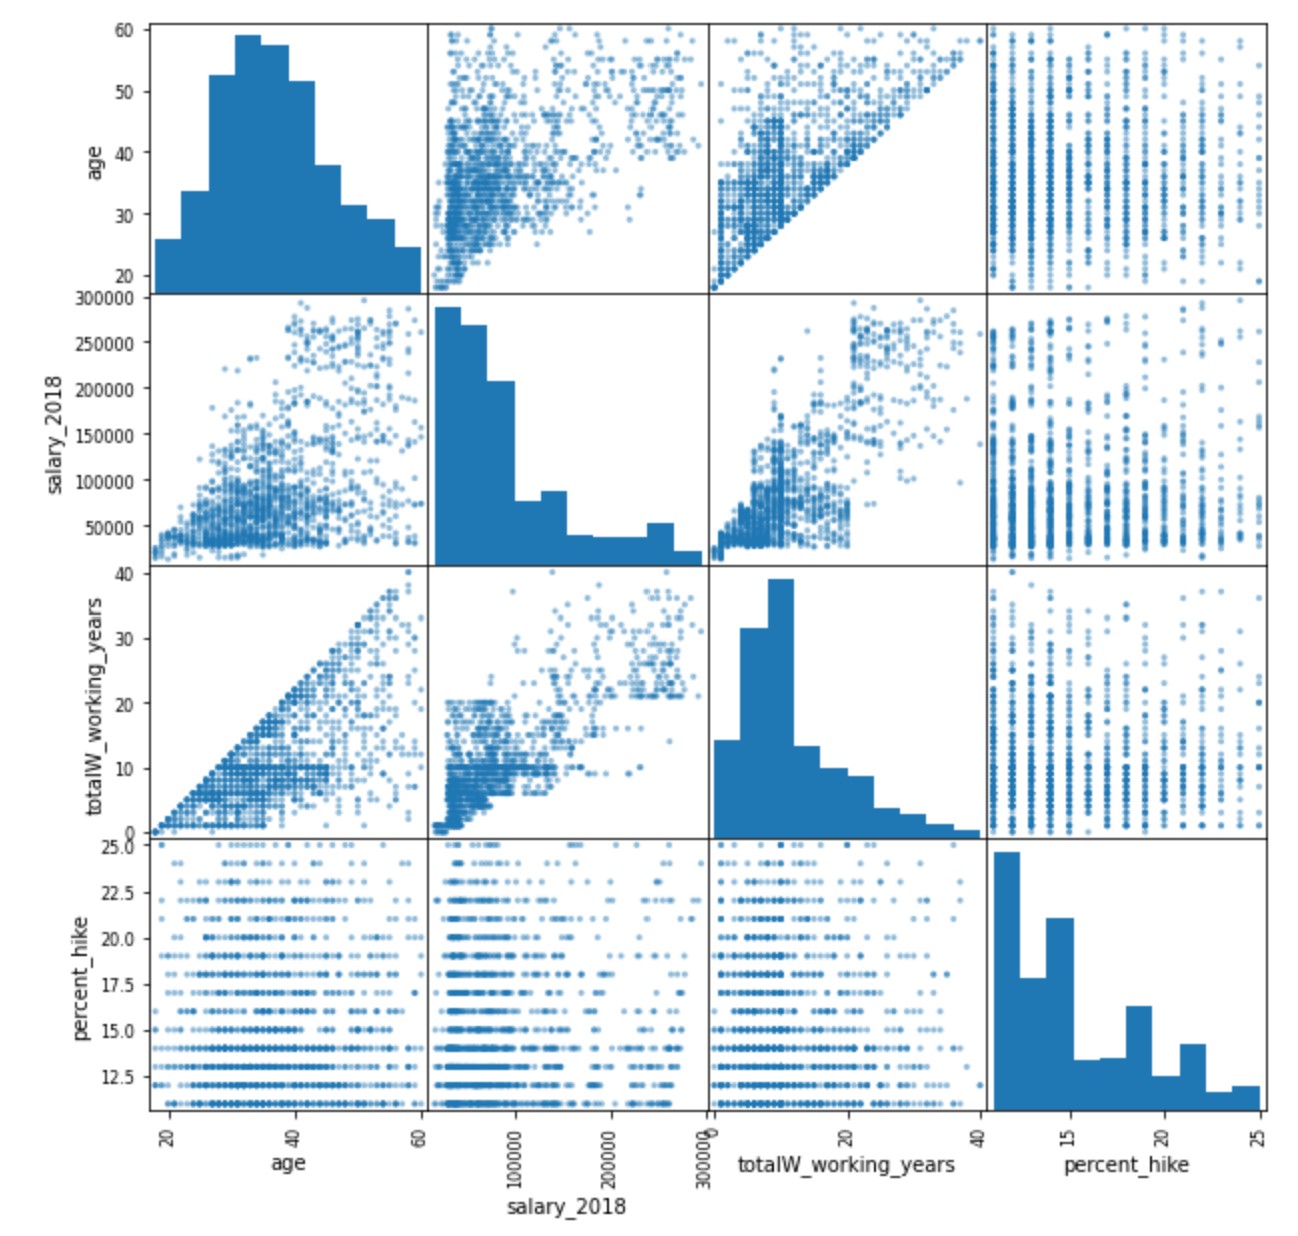
- Scatter Plot
- Scatter Matrix
- Covariance, Correlation
9. Bi-variate Analysis (Categorical and Categorical) by Pandas, Matplotlib
- Cross-Tab
- Proportion Table
- Slacked Chart
- Bar Chart
- Column Chart
- Mosaic Plot
10. Bi-variate Analysis (Numerical and Categorical) by Pandas, Matplotlib
- Descriptive Statistics
- Box Plot
11. Hypothesis Testing by Scipy
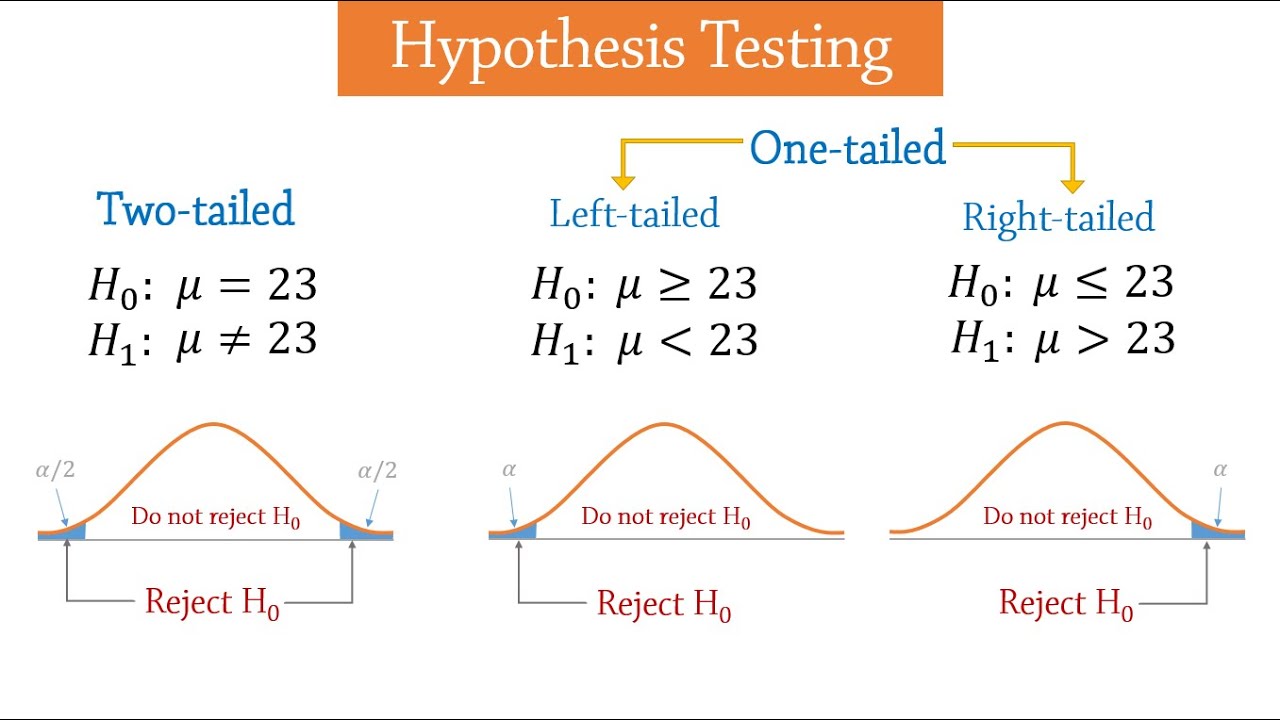
- One Sample T-Test
- Paired T-Test
- Chi-Squiare
- ANOVA
12. Variable Creation by Pandas, Numpy
- Tenure
- Compa Ratio
- Dummy Variable (Converting Category into Integer)
13. Variable Transformation by Pandas, Matplotlib, Scipy, Numpy
- Normalization
- Log Transformation
- Square Root Transformation
- Cube Root Transformation
- Binning*